Determine how control strategy changes operating cost, peak demand, renewable utilization, battery cycling, and outage performance while maintaining interval-by-interval power and energy balance.
A reproducible single-bus simulator that schedules PV, battery, and grid power under time-of-use prices, demand charges, equipment limits, and optional outages.
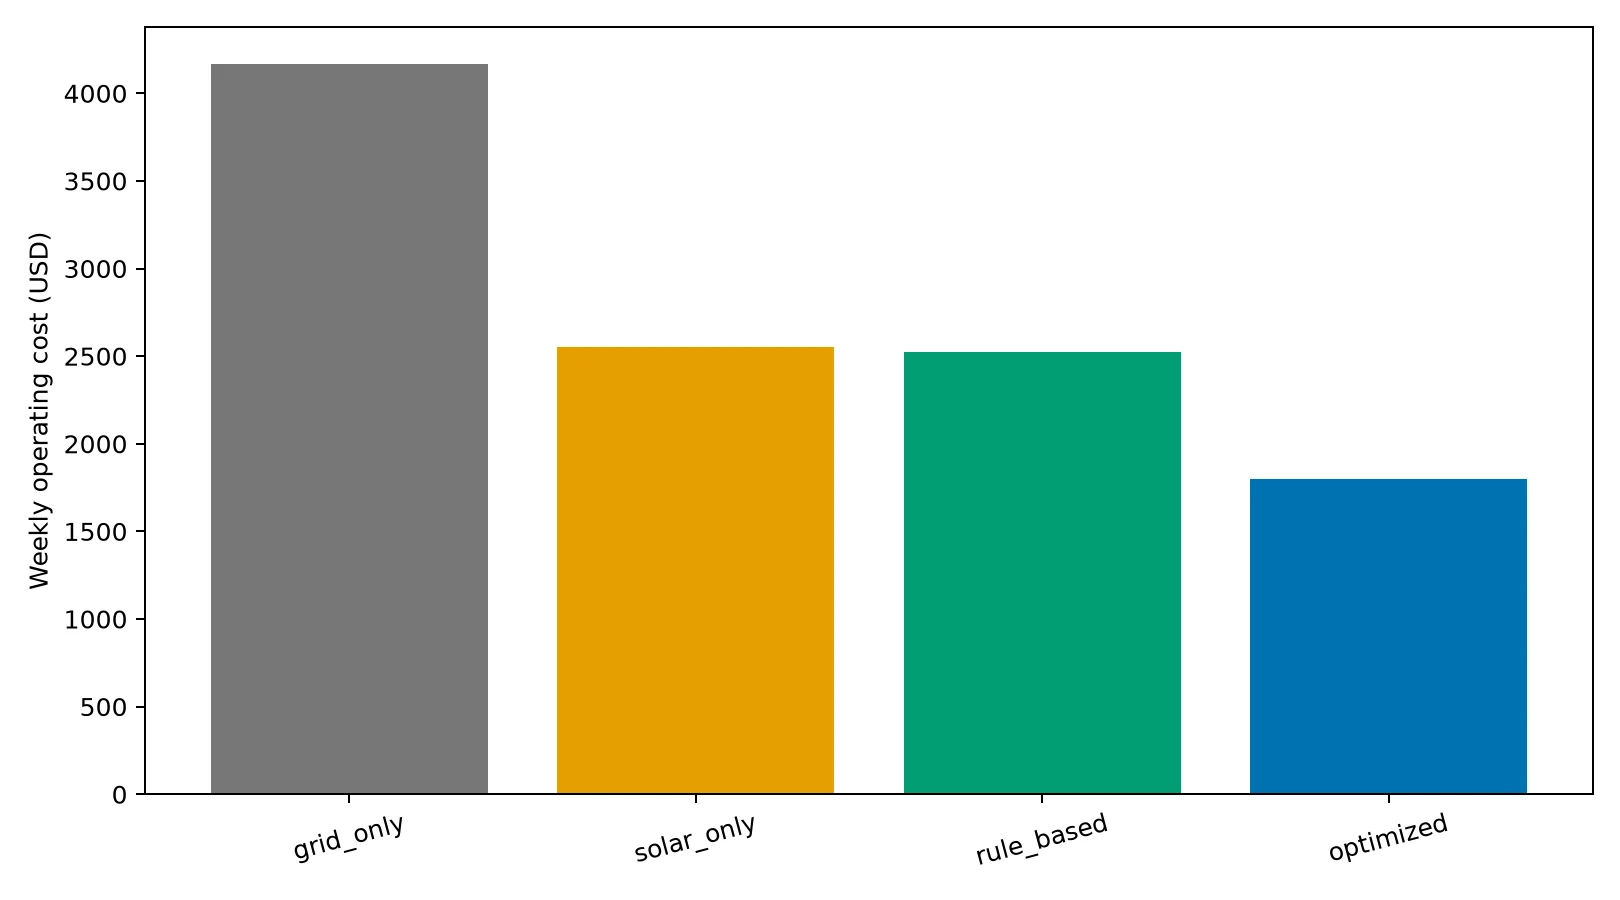
$1,800.27
Optimized weekly cost
Synthetic tariff; down from $4,169.94 grid-only
$2,369.67
Modeled savings
Optimized case versus grid-only over 168 hours
43.35 kW
Optimized peak import
Versus 101.01 kW in the grid-only case
890.90 kWh
Battery throughput
Active cycling under the simplified wear proxy
Project scope
168 hourly intervals using a fixed-seed synthetic commercial load and PV profile
Grid-only, solar-only, causal rule-based battery, and perfect-forecast MILP cases
Energy charges, demand charges, export credit, throughput cost, and unserved-energy penalty
Single AC bus; no feeder voltage, reactive power, transient, or protection model
System or processing architecture
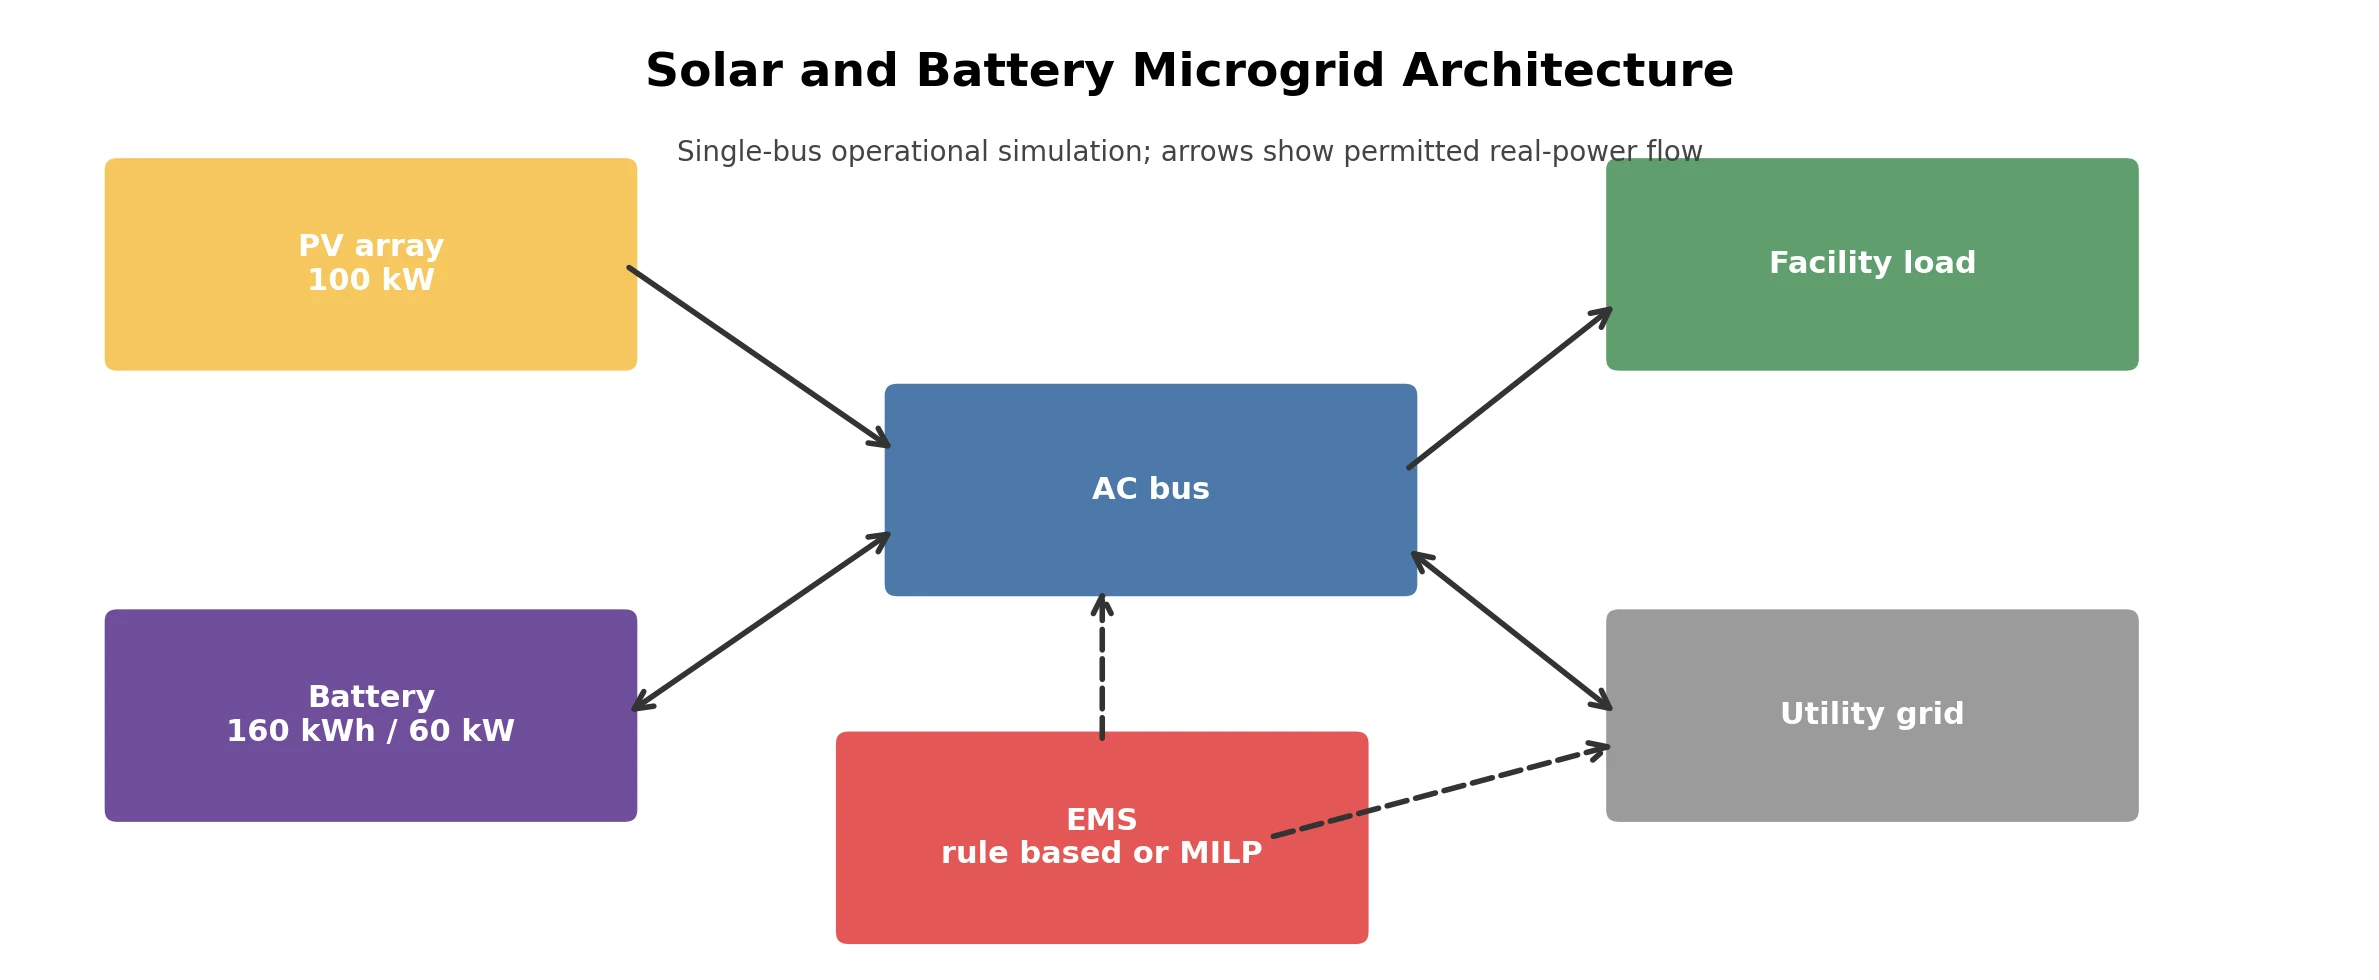
PV, a bidirectional battery inverter, the utility interconnection, and facility load meet at one modeled AC bus. A controller chooses battery and grid setpoints while the validation layer independently checks power balance and state-of-charge recursion.
My engineering contributions
Defined the sign conventions, SOC dynamics, dispatch limits, and cost model.
Implemented both a causal self-consumption controller and a SciPy/HiGHS mixed-integer optimizer.
Added binary charge/discharge exclusivity, outage isolation, peak-demand tracking, and a terminal-SOC constraint.
Built sensitivity studies, CSV/XLSX exports, plots, and automated engineering checks.
Important design decisions
Used a binary battery-mode variable so simultaneous charging and discharging are structurally impossible.
Required final SOC to meet or exceed initial SOC to prevent artificial end-of-horizon savings.
Kept the rule-based controller causal and the optimizer perfect-forecast so they serve distinct operational and benchmark roles.
Engineering methods
Hourly AC-bus energy balance
Efficiency-adjusted battery SOC recursion
Mixed-integer linear optimization
Fixed-seed scenario generation
Sensitivity analysis for PV, storage, tariffs, demand charges, SOC, and outage duration
Selected evidence
Readable results, with context
Figure 1Single-bus operational model and control boundary used by both battery strategies.
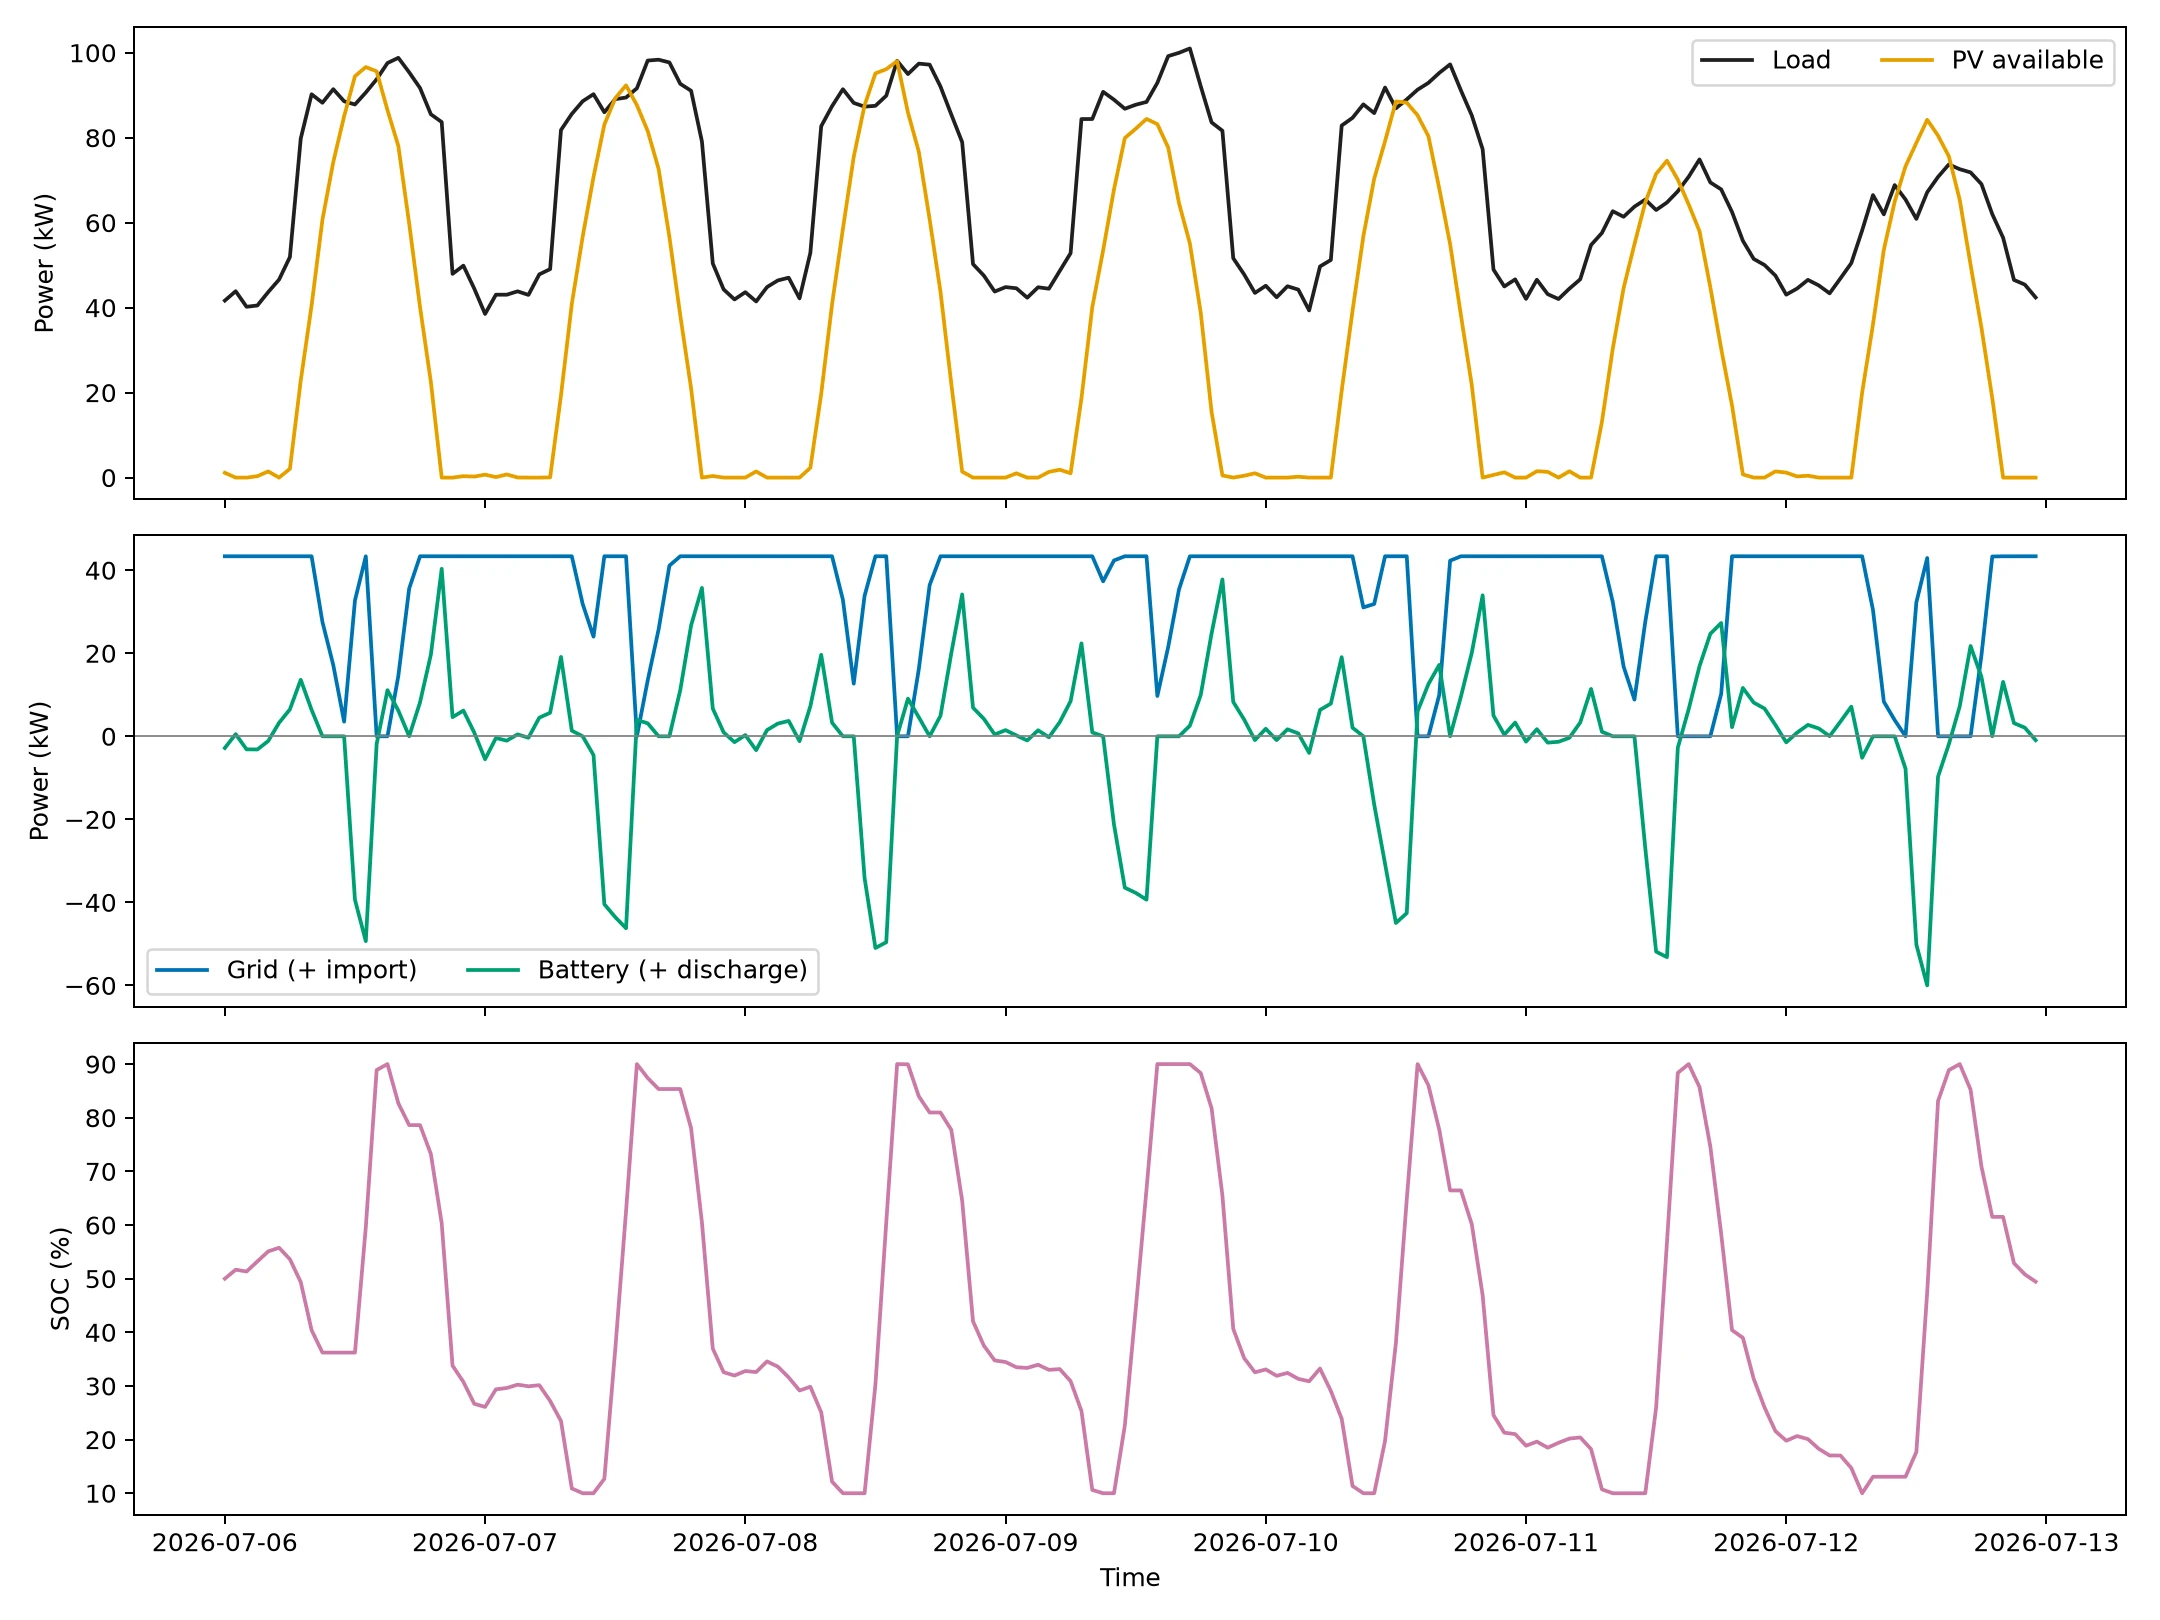
Figure 2Executed optimized dispatch. Positive battery power denotes discharge; all powers are hourly averages in kW.
Figure 3Synthetic weekly operating-cost comparison including energy, demand, and battery-throughput terms.
Verification and testing
Power-balance and SOC-dynamics residuals remain near numerical precision for all four controllers.
SOC stays within 16-144 kWh for the 160 kWh battery configuration.
Automated tests verify balance, bounds, mutual exclusivity, and zero grid exchange during outage intervals.
Fixed seed 321 and machine-readable run metadata make the published week reproducible.
Honest limitations
Synthetic hourly data and a short billing window; savings are scenario estimates, not a utility bill forecast.
The optimizer assumes perfect foresight and is not a deployed real-time controller.
Fixed efficiency and linear throughput cost do not model electrochemical degradation or temperature.
No reactive power, network voltage, inverter kVA, interconnection, or hardware behavior is represented.